
 Neet Rank Predictor
 NEET UG Predictor
 MDS Predictor
 INI CET Predictor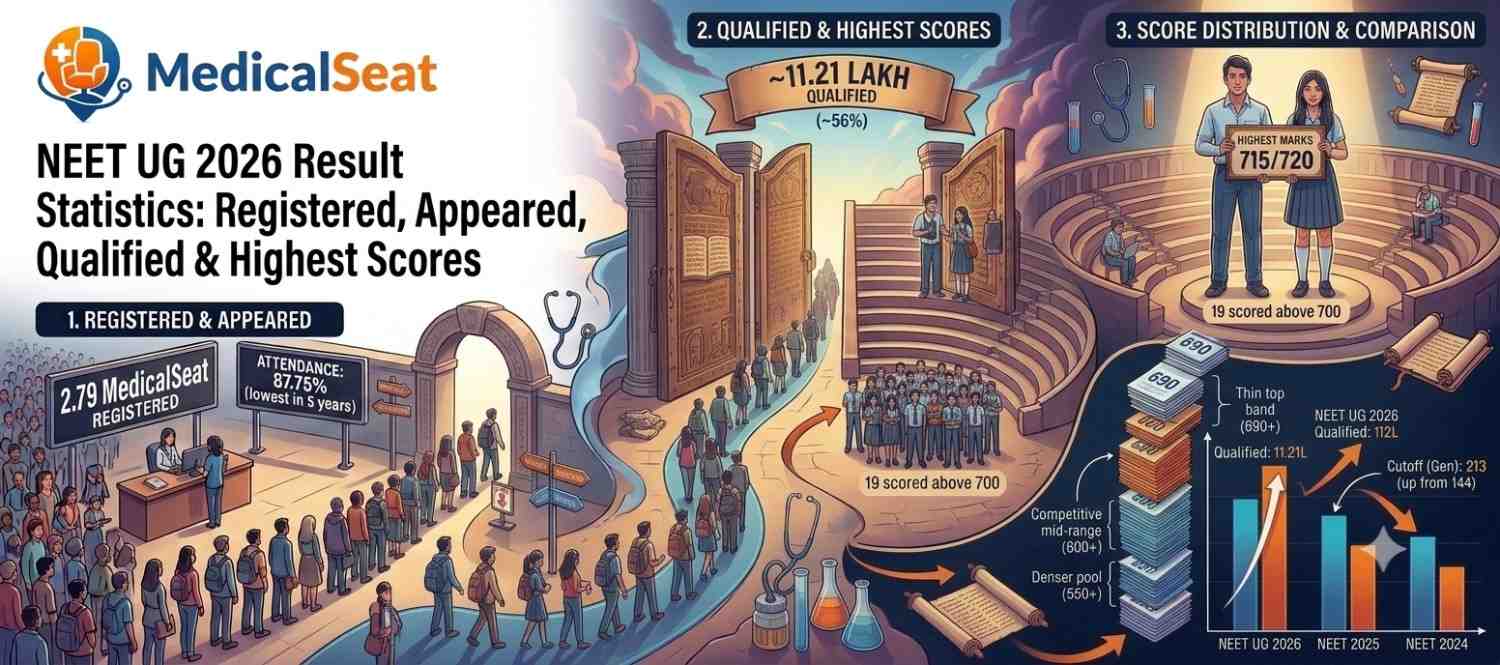
NEET UG 2026 Result Statistics: Registered, Appeared, Qualified & Highest Scores
22.79 lakh registered, 11.21 lakh qualified, 715/720 highest score. Full registered vs appeared vs qualified data.
NEET UG 2026 Result Statistics show 22.79 lakh registered, ~20 lakh appeared (87.75% attendance — the lowest in five years), and 11.21 lakh qualified (~56% qualification percentage). The NEET highest score was 715/720, jointly held by two candidates, with 19 scoring above 700 and 138 above 690. Women made up 58%+ of all qualified candidates. Compared with NEET Result Statistics 2026's predecessor, NEET 2025 (12.36 lakh qualified, 686 highest) and NEET 2024 (13.15 lakh qualified, 720 highest), this year's NEET Result Analysis shows fewer overall qualifiers but a sharper top end.
Every year, the NEET Result Data tells a bigger story than just one topper's marks — it tells you how many people you're actually competing against, how the exam behaved, and whether this was a tougher or easier cycle than the one before. This NEET UG 2026 Result Statistics breakdown — also searched as NEET Result Statistics 2026, NEET UG Statistics, and NEET 2026 Statistics — covers exactly that: NEET Registered Candidates vs NEET Appeared Candidates, NEET Qualified Candidates, category-wise and gender-wise NEET UG 2026 statistics, the full NEET Score Distribution, and a direct NEET UG 2026 vs NEET 2025 statistics comparison — so you know where you actually stand, not just what your own scorecard says. This is also relevant Re NEET 2026 result statistics and NEET re-exam statistics, since this cycle followed a rescheduled Re-NEET exam.
NEET UG 2026 Result Statistics: 22.79 lakh candidates registered, around 20 lakh appeared (87.75% attendance), and 11.21 lakh qualified — roughly a 56% qualifying percentage NEET. The NEET UG 2026 highest marks were 715/720, shared by two candidates. 19 candidates scored above 700 in NEET 2026, 138 scored above 690, and women accounted for over 58% of all qualified candidates this cycle.
Table of Contents
NEET UG 2026 Result Statistics: Key Highlights
NEET UG 2026 Registered vs Appeared Candidates
How Many Students Qualified NEET UG 2026?
Category-Wise NEET Statistics — Qualified Candidates
NEET 2026 Gender-Wise Statistics
NEET UG 2026 Highest Scores & Score Distribution
NEET Toppers Statistics
NEET UG 2026 vs NEET 2025 vs NEET 2024 Statistics
Five Biggest Takeaways from NEET UG 2026 Statistics
What These Statistics Mean for Counselling
Common Mistakes While Reading NEET Result Statistics
Expert Tips
FAQs
Conclusion
1. NEET UG 2026 Result Statistics: Key Highlights
Metric | NEET UG 2026 Data |
Result Date | 16 July 2026 |
Exam Date (Re-NEET) | 21 June 2026 |
NEET Registered Candidates | 22.79 lakh (approx.) |
NEET Appeared Candidates | ~20 lakh |
NEET UG 2026 Attendance Percentage | 87.75% |
Total Absent | ~2.79 lakh |
NEET Qualified Candidates | 11.21 lakh |
NEET UG 2026 Qualification Percentage | ~56% |
NEET UG 2026 Highest Marks | 715/720 |
AIR 1 Score | 715/720 (joint — 2 candidates) |
How many students scored above 700 in NEET 2026 | 19 |
How many students scored above 650 in NEET 2026 | 1,492 |
Female Qualified % | 58%+ |
Male Qualified % | Remaining ~42% |
This table is your quick-reference NEET Result Data snapshot for NEET Result Statistics 2026 — every section below unpacks one row in detail, with the "why it matters" explained rather than just the number.
2. NEET UG 2026 Registered vs Appeared Candidates
How many students registered for NEET UG 2026? According to NTA figures, over 22.79 lakh candidates registered for the Re NEET 2026 result statistics cycle. How many students appeared for NEET 2026? Just under 20 lakh NEET Appeared Candidates, giving an NEET UG 2026 attendance percentage of 87.75% — meaning close to 2.79 lakh registered candidates were absent.
Did Absenteeism Increase?
Yes, significantly. This is one of the most important NEET re-exam statistics this cycle, and a key part of any complete NEET Result Analysis:
Year | Attendance Rate |
NEET UG 2026 (Re-exam, 21 June) | 87.75% |
NEET UG 2026 (Original attempt, 3 May — later cancelled) | 96.72% |
NEET UG 2022 | 94.23% |
NEET UG 2021–2025 average | 95%+ |
An 87.75% attendance rate is the lowest recorded in at least five examination cycles. Was attendance affected by the re-exam? Almost certainly — a second attempt scheduled after the original May exam was cancelled meant some NEET Registered Candidates had already committed to other plans, dropped out due to preparation fatigue, or simply couldn't make the new date work. Careers360 and other outlets have flagged this as a NEET Result Trends point worth watching, since a nearly 12-point drop in attendance directly reduces effective competition for the same number of seats — a key input into any NEET data analysis and NEET exam analysis.
3. How Many Students Qualified NEET UG 2026?
11.21 lakh NEET Qualified Candidates out of the ~20 lakh who appeared — a NEET UG 2026 qualification percentage of roughly 56%.
NEET UG 2026 Qualification Percentage: 2024 vs 2025 vs 2026
Year | Appeared | Qualified | Qualification % |
NEET 2024 | ~24 lakh (registered) | ~13.15 lakh | 56.35% |
NEET 2025 | 22,09,318 | 12,36,531 | 59.07% |
NEET UG 2026 | ~20 lakh | 11.21 lakh | ~56% |
Is Qualifying Becoming Easier or Harder?
Neither, cleanly — it's shifting. The qualifying percentage NEET figure for 2026 sits close to 2024's level and lower than 2025's, but that's misleading on its own: 2026 had fewer candidates appear in absolute terms due to the attendance drop, while the NEET cutoff 2026 qualifying marks rose sharply compared with 2025 (covered in Section 8). In short: a smaller pool appeared, cutoffs rose, and the qualification rate landed roughly mid-range historically — this is a NEET data analysis and NEET performance analysis point that raw percentages alone don't fully capture.
4. Category-Wise NEET Statistics — Qualified Candidates
Official reporting alongside the result and cutoff notification gives this NEET 2026 category-wise qualified candidates breakdown:
Category | Qualified Candidates (2026) |
UR/EWS | 9,96,935 |
OBC | 81,111 |
SC | 29,947 |
ST | 12,452 |
Total | ~11.21 lakh |
Which Category Had the Highest Number of Qualifiers?
The UR/EWS category overwhelmingly accounts for the largest share of qualified candidates, consistent with its larger registered base and the 50th-percentile qualifying threshold applying to a bigger pool of test-takers. OBC follows as the second-largest qualifying group. Detailed registered-vs-appeared figures broken down by category (rather than just "qualified") have not been separately published in the NEET result data released so far — check the official NTA result PDF for any further category-wise NEET statistics once available.
5. NEET 2026 Gender-Wise Statistics
Metric | Female | Male |
Share of Total Qualified | 58%+ | ~42% |
Qualification Rate (qualified ÷ appeared, within gender) | 56.8% | 55.1% |
Why This Trend Matters
Female candidates account for over 58% of all qualified candidates in NEET UG 2026 gender-wise statistics — and notably, women also qualified at a slightly higher rate (56.8%) than men (55.1%), meaning the gender gap isn't just about more women appearing, it's also about a marginally stronger qualification rate among those who did. This continues a NEET participation statistics trend of rising female representation in Indian medical education admissions. Third-gender registration and qualification figures have not been separately published in the NTA result statistics available so far.
6. NEET UG 2026 Highest Scores & Score Distribution
Score Range | Number of Students (2026) |
700+ | 19 |
690+ | 138 |
650+ | 1,492 |
600+ | 10,160 |
550+ | Not separately published yet |
500+ | ~90,780 (as per available reporting) |
What the NEET Score Distribution Tells You
The gap between the 700+ scorers (19) and the 690+ scorers (138) shows how thin the very top band is — under 20 candidates crossed 700 out of nearly 20 lakh who appeared. By the time you move to 600+ (10,160 candidates), the pool widens dramatically, which is the range most AIQ counselling competition for top government colleges actually plays out in, rather than the sub-20-candidate 700+ band that dominates headlines. This NEET rank distribution and AIR distribution pattern is central to any serious medical entrance statistics review.
7. NEET Toppers Statistics
NEET UG 2026 highest marks: 715/720, jointly held by Aryan Gupta (Punjab) and Panshul Bansal (Haryana)
19 candidates scored above 700
17 candidates scored above 705, spanning eight states: Punjab, Haryana, Rajasthan, Uttar Pradesh, Maharashtra, Bihar, Tamil Nadu, and Telangana
First-time vs repeat candidates: More than 93% of the top 138 scorers (690+) were first-time test takers
Age group: Nearly 99% of the top scorers were aged 17–19
This NEET UG 2026 topper statistics pattern — a young, largely first-attempt top band spread across eight states — is a strong data point for any NEET merit analysis, showing this year's highest performers weren't concentrated by geography or repeated attempts, unlike some past cycles where repeaters featured more heavily in the very top ranks.
8. NEET UG 2026 vs NEET 2025 vs NEET 2024 Statistics
Metric | NEET 2024 | NEET 2025 | NEET UG 2026 |
Registered | 24,06,079 | 22,76,069 | ~22.79 lakh |
Appeared | ~23 lakh (est.) | 22,09,318 | ~20 lakh |
Qualified | ~13.15 lakh | 12,36,531 | 11.21 lakh |
Highest Marks | 720/720 (17 shared AIR 1) | 686/720 (single AIR 1) | 715/720 (2 shared AIR 1) |
Qualification % | 56.35% | 59.07% | ~56% |
General Cutoff | 720–162 | 686–144 | 715–213 |
Reading the Trend — NEET Result Trends and NEET 2026 Competition
Registered candidates have been gradually declining since the 2024 peak of over 24 lakh, continuing into 2026.
NEET UG 2026 registered vs appeared candidates shows the widest gap of these three years, driven by the re-exam's unusual 87.75% attendance.
Qualified candidates fell for the second year running — from 13.15 lakh (2024) to 12.36 lakh (2025) to 11.21 lakh (2026).
The qualifying cutoff jumped sharply in 2026 versus 2025 (General: 144 → 213), even though the highest score of 715 sits between 2024's 720 and 2025's 686 — showing the middle-to-upper score band shifted up more than the very top score did. This is core cutoff comparison and NEET score trends data for any 2027 aspirant.
9. Five Biggest Takeaways from NEET UG 2026 Statistics
The qualifying cutoff jump matters more than the headline topper score. A General cutoff of 213 (up from 144) means far more mid-scoring candidates cleared the qualifying line even as fewer candidates qualified overall — competition is now denser in the 550–650 range than the raw "qualified" number suggests.
NEET 2026 competition intensified at the very top. 2026 produced 19 candidates above 700 versus zero in 2025 (where the highest score was only 686) — a clear sign the top band performed stronger this cycle.
Fewer qualifiers than 2024 or 2025. At 11.21 lakh, this is the lowest total NEET Qualified Candidates figure of the last three cycles, driven largely by the attendance drop rather than a harder paper alone.
Attendance, not just difficulty, reshaped this year's numbers. An 87.75% turnout — down from 95%+ in typical years — means direct year-on-year comparisons of "how many qualified" need the attendance context, not just the raw count.
Women's qualification edge continued. At 58%+ of all qualifiers and a higher qualification rate than men, gender participation trends held steady and even strengthened slightly this cycle.
Note: Points on likely counselling impact below are framed as expectations based on these patterns, not confirmed outcomes — actual MBBS admission statistics and admission cutoffs will only be known once counselling rounds conclude.
10. What These Statistics Mean for Counselling
More qualifiers (or fewer) doesn't directly translate to easier or harder admission. What matters for your actual seat is your AIR and category rank against a specific college's closing rank — not the national NEET UG official result qualification percentage.
AIR matters more than raw marks once you're in the counselling pool. Two candidates with similar marks can have meaningfully different AIR based on percentile and tie-breaking rules.
Category and state quota heavily influence outcomes. The category-wise NEET statistics above are a starting point, not a prediction — your state quota position and category rank matter more locally than the all-India total.
Estimate realistically using rank and previous closing ranks, not this year's headline statistics alone. Run your confirmed AIR through a NEET Rank Predictor and check likely options with a NEET College Predictor before you fill counselling choices — and if you're weighing options beyond MBBS, MedicalSeat's AI Rank Predictor covers MDS and INI CET pathways too.
11. Common Mistakes While Reading NEET Result Statistics
Comparing raw "qualified" numbers year-on-year without checking the NEET UG 2026 attendance percentage behind them
Assuming a lower qualification percentage NEET figure automatically means "tougher competition" for every candidate, when it can also reflect fewer people appearing
Treating the qualifying cutoff as the number that determines admission, rather than a minimum eligibility line
Ignoring category-wise and gender-wise NEET UG 2026 statistics when self-comparing against "the average" candidate
Focusing only on the sub-20 candidate 700+ band instead of the much larger 600+ pool most real competition happens in
12. Expert Tips
When comparing NEET Result Statistics across years, always check both the NEET Qualified Candidates number and the attendance rate — a 2-lakh drop in qualifiers can come from a genuinely tougher paper or simply from fewer people showing up.
Use category-wise NEET statistics as context, not as a direct predictor of your own counselling outcome — your category rank, not the national category total, is what counselling authorities actually use.
Track the cutoff comparison year-on-year rather than the highest score alone; cutoff shifts tell you more about where the bulk of competition sits than a single topper's marks do.
Key Takeaways
22.79 lakh NEET Registered Candidates, ~20 lakh NEET Appeared Candidates (87.75% attendance), 11.21 lakh NEET Qualified Candidates in NEET UG 2026.
NEET UG 2026 highest score: 715/720, shared by 2 candidates; 19 candidates crossed 700.
Qualifying cutoffs rose sharply versus 2025 across every category.
Women made up 58%+ of all qualified candidates with a slightly higher qualification rate than men.
Fewer total qualifiers than 2024 and 2025, driven significantly by this cycle's unusually low attendance.
National NEET Result Statistics are context — your own AIR and category rank decide your actual counselling outcome.
13. Conclusion
The NEET UG 2026 Result Statistics paint a more nuanced picture than a single "11.21 lakh qualified" headline suggests. Registration held roughly steady, but a sharp drop in attendance reshaped this cycle's effective competition, while qualifying cutoff marks rose meaningfully across every category compared with 2025. Reading these numbers together — not the NEET UG 2026 highest marks in isolation — gives a far more accurate sense of where this year's competition actually concentrated. As you move into counselling, treat this NEET Result Analysis as context for planning, and lean on your own confirmed AIR and category rank, checked against a proper rank and college predictor, to make your actual decisions.
Get Your Real Rank and College Match Before Counselling Opens
Every guess costs you a round. Head to MedicalSeat.com and run your score through a rank and college predictor that's actually calibrated for this year's re-exam pattern — MBBS, MDS, INI CET, and AYUSH, all in one place.
Talk to a counselling expert directly: 📞 +91 97517 95765 📧 support@medicalseat.com
Free to start · Trusted by 50,000+ NEET aspirants